Before You Begin
Purpose
This tutorial steps you through the process of implementing a Custom Visualization Component with a focus on using the CVC JavaScript API to develop a renderer class to drive the visualization.
Time to Complete
Approximately 2 hours
Background
The Custom Visualization Portlet provides a means for the end user to define new types of data visualizations using a client-side library of their choice entirely within BDD Studio. Creating a new visualization type is as easy defining an EQL query and providing a JavaScript class to render the query response, but also provide points of flexibility to accommodate a variety of applications of the visualization type, as well as allow for end user interaction with the visualized data.
A Custom Visualization consists of three main parts:
1) EQL statement(s) to acquire the data to visualize
2) A collection of "token" definitions that define variables used in the EQL statements and dictate how those values are acquired
3) A JavaScript class that uses the Custom Visualization Component (CVC) JavaScript API to execute the queries and transform the query response into a graphical representation of the data.
The JavaScript renderer class initiates the visualization process by executing a pre-defined EQL statement. The CVC portlet substitutes variables in the EQL statement (called tokens) with values such as attribute keys and aggregation functions that are taken from user selections in the 'Edit Setting' panel and other sources. The results of the query are passed back to the renderer class which then renders the data to the screen through DOM manipulation.
Notes
Though any rendering technology may be used to draw
visualizations on the portlet canvas, the following
examples use the Data-Driven Documents or D3
rendering library. Use of D3 is beyond the scope
of this document. Readers are encouraged to become
familiar with the basics of D3 to acquire a
complete understanding of the information
contained within.
JavaScript
code examples may have been simplified for
clarity. A complete, commented example of the
Donut Pie renderer class implementation is
referred to in the Developing a Renderer Class
section of this tutorial and is available for
download from the Before You Begin -> What Do
You Need? section of this tutorial. It is
also available for download from the Oracle Big
Data Discovery Oracle Technical Network (OTN) page
(Downloads tab).
What Do You Need?
Click the Sample CVC Code link below to download the JavaScript renderer code and the Studio configuration for the Donut Pie custom visualization component.
Sample CVC CodeProcess Overview
Creating a Custom Visualization Component in Studio's Control Panel
-
In the Studio header, click the Configuration Options icon and select Control Panel. :

-
From the Control Panel select Custom Visualizations.

-
Click + Component:

- Specify a name for the component. This is the display name of the component in the Discover menu.
- Optionally, check Browse to locate an icon image for the component and then click Upload and Ok.
- In JavaScript File, specify the JavaScript file that implements your Custom Visualization Component by clicking Browse, locating the file, and clicking Open.
- In Renderer class, specify
the fully qualified name of the JavaScript
class that renders the component.
For example, in the following JavaScript snippet, the name of the renderer class isOracle.BDD.Portlets.Visualization.Renderers.DonutPieChart:
This rendering class uses the CVC JavaScript API to initiate queries and render the returned data to the portlet. Please refer to the Developing a Renderer Class section of this document for more details on how to write this code.Oracle.BDD.Portlets.Visualization.Renderers.DonutPieChart = Oracle.BDD.Portlets.Visualization.Renderers.BaseRenderer.extend({ init: function() { /** * Get the queryConfig for the initial query */ var queryConfig = this.getQueryConfig("eql"); … }); - Select a Sort type of one
of the following:
• None - Specifies that there is no sort option available for the business user to configure in the component.
• Defined - Specifies that the sort option for the component is defined by token replacement in an EQL statement. A business user then sorts by value of the token in either an ascending or descending order. Please refer to the Visualization Configuration section of this document for details on the token definitions and usage.
• Per Dimension - Specifies that a sort option is available for any token defined as a dimension. Please refer to the Visualization Configuration section of this document for details on the token definitions and usage. - Optionally, expand Advanced Options
and specify the following:
• CSS - Specifies visualization-specific CSS. Also note that the CSS is scoped to the visualization's DOM container.
• External CSS - Specifies a list of URLs to external CSS files. Each URL should be line separated. These CSS files override any CSS in the JavaScript file. This last line is inaccurate. There is no CSS in the JavaScript file.
• External JavaScript - Specifies a list of URLs to external JavaScript files. Each URL should be line separated. These JavaScript files might provide additional resources, such as third-party plugins, to support the JavaScript file. Could we call it the “JavaScript renderer” rather than “file”?
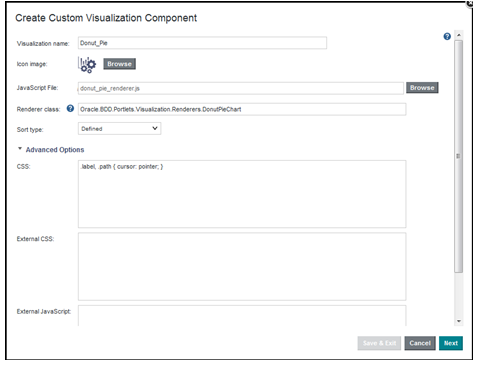
- Click Next.
- In EQL query name, specify
the name of the EQL query used in the
JavaScript API function
getQueryConfig.
var
queryConfig = this.getQueryConfig("eql");
...
- Paste the EQL query for your component into the text box. For details of EQL syntax please refer to the Oracle Big Data Discovery EQL Reference Guide.
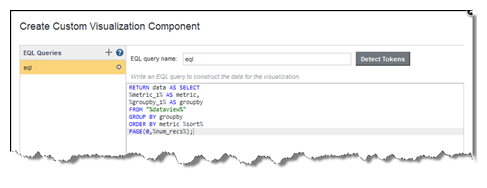
- Click Detect Tokens
FROM
clause appear in Views.
Tokens in a WHERE clause appear in
Data.
Please refer to the Visualization Configuration
section of this tutorial for details on the
token definitions and usage. An example illustrating this step using the Donut_Pie custom visualization component is shown below:
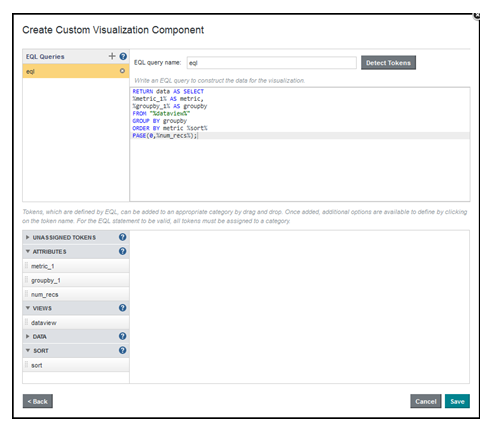
- If any of the tokens are
incorrectly categorized, click the token and
drag and drop it into the correct
category. For the case of the Donut_Pie
custom component you need to drag and drop
num_recs into the DATA category.
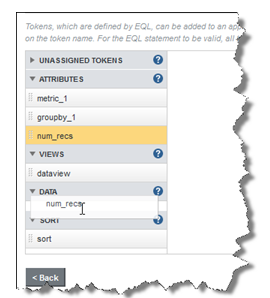
- Click each token name and specify the details of how the token is used in the component.


- Optionally, you can add more EQL queries to the component by clicking + and repeating steps 11 – 15 for each EQL query. Each query that you add generates an additional result set for the component to use.
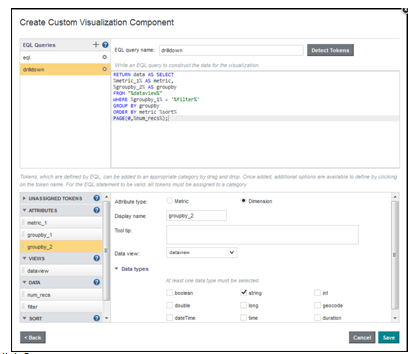
- Click Save.
- From the custom visualizations menu in Studio’s Control Panel check Published to publish this component. This allows this custom visualization to be used by non-administration type users.

As the developer of the custom visualization component you may want to keep this CVC unpublished until you test using it in a Discover project.
For more details on publishing, unpublishing and deleting custom visualization components please refer to the respective sections covered later in this tutorial.
Instantiating and Configuring a CVC in a Studio Project
-
From Studio’s Catalog, find the project in which you want to use the CVC and click it to open the project

-
Click Discover.

- From the Add Component menu find the Custom Visualization Component (located toward the bottom of the list) and drag it on to the page.

-
In the Custom Visualization Component, click the pencil icon to edit the configuration settings.

-
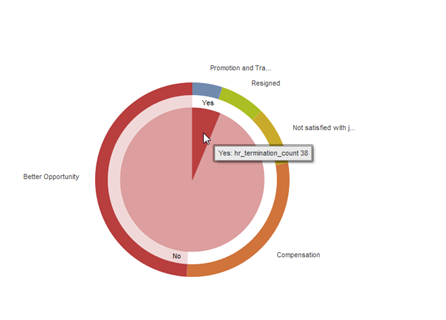
In the Visualization Setting section, select the appropriate attributes for each token defined in the CVC definition. For the Donut_Pie CVC example using a sample workforce_hr data set (sample data set is not provided with this distribution) the 3 attributes specified are:
metric_1 = hr_termination_count (aggregation type = sum)
groupby_1 = hr_source_event_reason_description
groupby_2 = hr_employee_high_potential_flag

Notice the
visualization now is displayed. You can
click and/or mouse over various sections of the
donut to report more information.
For example, using this particular data set if
you click on Better Opportunity part of the
donut, you see additional information displayed
within the donut (in this case, if the employee
who resigned was tagged by HR as a high
potential employee).
Overview of the API Features of the Donut_Pie Chart Example
1. Visualization using D3
3. Truncate text
4. Multiple queries
5. Color Management
6. Tooltips
7. Refinements
8. Custom error handling
For details on how to use these features of the CVC API please refer to the Developing a Renderer Class section of this tutorial and the Custom Visualization Component API Reference Guide.
Publishing a Custom Visualization Component
To publish a Custom Visualization Component:
1. In the Studio header, click the Configuration Options icon, select Control Panel and then select Custom Visualizations.
2. Locate the component you want to make available and click Published.
The component immediately becomes available on the component menu of the Discover page.
Unpublishing a Custom Visualization Component
To unpublish a Custom Visualization Component:
1. In the Studio header, click the Configuration Options icon, select Control Panel and then select Custom Visualizations.
2. Locate the component you want to make unavailable and deselect Published.
3. Click UnPublish.
Deleting a Custom Visualization Component
To delete a Custom Visualization Component:
1. In the Studio header, click the Configuration Options icon, select Control Panel and then select Custom Visualizations.
2. Locate the component you want to remove and click Remove.
3. In the confirmation dialog, click Delete.
Visualization Configuration
EQL
Sample Query
RETURN data AS SELECT
%metric_1% AS metric,
%groupby_1% AS groupby
FROM "%dataview%"
GROUP BY groupby
ORDER BY metric %sort%
PAGE(0,%num_recs%);
There are five different varieties of tokens, distinguished by what type of data the token represents (attribute key, sort direction, etc.) and by how its value is acquired.
| Type | Subtype | Default Value | Example Replacement Value |
|---|---|---|---|
| attribute | metric | End user selection of attribute and aggregation function from user control in 'Edit Settings' panel. Values may also be set with the CVC JavaScript API. | SUM(p_price) |
| attribute | dimension | End user selection of attribute from user control in the 'Edit Settings' panel. Values may also be set with the CVC JavaScript API. | p_color |
| view | End user selection of a data view from user control in the 'Edit Settings' panel | ||
| sort | User selection of a sort direction (ASC or DESC) from a user control in the 'Edit Settings' panel. Values may also be set with the CVC JavaScript API. | ASC | |
| data | No default value. Data token values must be explicitly set by the renderer JavaScript class |
Token Substitution
Prior to query execution, the EQL is parsed for tokens and a string value is substituted according to the "type" of token used:
| Before Token Substitution | After Token Substitution |
|---|---|
RETURN data AS SELECT |
RETURN data AS SELECT |
Token
configuration settings to use in
Studio’s Control Panel when creating the
CVC
| Token | Setting |
|---|---|
%metric% |
attribute(metric) |
| %groupby_1% | attribute(dimension) |
| %dataview% | view |
| %sort% | sort |
| %num_recs% | view |
JavaScript Renderer Class
Developing a Renderer Class
A renderer class has two requirements:
1. It must extend
Oracle.BDD.Portlets.Visualization.Renderers.BaseRenderer
2. It must implement the init()
function in which engagement with the end user
begins
BaseRenderer
Oracle.BDD.Portlets.Visualization.Renderers.BaseRenderer is the JavaScript class from which all Custom Visualization renderer classes must extend. The BaseRenderer provides a number of functions for defining, modifying and executing queries (see the General Workflow section), accessing the DOM element onto which visualization element are appended(see the Rendering the Visualization section), displaying informational and error messaging in the portlet space (see the Error Handling and Messaging section), as well as a number of utilities for color management (see the Using Colors section) and text display.
init()
init() is executed on every page load
containing the component. It is here that the
visualization "begins". This typically means querying
for data and directing the query response as described
below.
General Workflow

- On page load, the CVC client-side controller inspects the visualization configuration and renders a dropdown control for each attribute, view and sort token in the 'Edit Settings' panel. Default values are set according to the user's saved default state.
- The CVC controller instantiates an instance of the renderer class and calls its init() function
- In the init() function, a queryConfig object for the EQL query to execute is acquired. The queryConfig references an EQL statement and contains the token values set by user selection.
- Token values may also be set by accessing the token from the queryConfig object and modifying its properties
- The renderer class executes the query, passing the queryConfig and specifying a function to call when the results have returned
- The CVC controller executes an Ajax call to the portlet backend to query for the data
- The query results are bundled in a queryResults object which is passed to the callback function
- A reference to the renderer's allocated DOM space, called the canvas, is acquired and the visualization is drawn by appending HTML and SVG elements to the canvas's top-level, or _root_, element
Oracle.BDD.Portlets.Visualization.Renderers.DonutPieChart =
Oracle.BDD.Portlets.Visualization.Renderers.BaseRenderer.extend({
init: function() {
/**
* Get the queryConfig for the initial query
*/
var queryConfig = this.getQueryConfig("eql");
/**
* Set default value for num_recs data token
*/
queryConfig.getToken("num_recs").setValue("10");
/**
* Execute the initial query, indicating renderDonut()
* as the callback
/*
this.executeQuery(queryConfig, true, this.renderDonut);
},
/**
* Callback function to render donut
*/
renderDonut: function(queryResults) {
/**
* Acquire reference to canvas
*/
*/
var canvas = this.getCanvas();
/**
* Acquire reference to canvas root
*/
*/
var root = canvas.getRoot();
}
});Defining Queries
Queries are configured using the QueryConfig object. A queryConfig object is associated with an EQL statement in the visualization configuration. A queryConfig object has a collection of token definitions, each associated with a token defined in the visualization configuration. Unless the token value has been modified by the JavaScript API, attribute, sort and data token values reflect the user selections in the 'Edit Settings' panel.
Accessing the QueryConfig Object
getQueryConfig(queryName)
returns the last successfully
executed QueryConfig object of the provided
queryName. If none exists, a QueryConfig
object with a token configuration reflecting
the selections made in the "Edit Settings"
portlet panel is returned. queryName
corresponds to the name given to the EQL
statement in the visualization
configuration.
/**
* Get the queryConfig for the initial query
*/
var queryConfig = this.getQueryConfig("eql");
Accessing and Modifying Token Properties
Calling
getToken(tokenName) on a
QueryConfig returns a Token object of a
subclass corresponding to the token type
(metric, dimension, data, etc.).
All tokens provide the getType()
function which returns the token type (e.g.
'metric', 'dimension', 'sort', data' or
'dataview') and getValue() to
return the string value that was used to
replace the token in the queryConfig's EQL
query. All other getter/setter functions are
unique to the Token subclass. See the API
documentation for all available
getter/setters.
The Token object and its subclasses should
not be instantiated directly; they should
only be accessed via the QueryConfig object
and only the supported setter functions used
to set property values.
In this example, the num_recs data token's
value is accessed. If no value exists, then
a value of "10" is set:
Token
Properties
/**
* Get the queryConfig for the initial query
*
var queryConfig = this.getQueryConfig("eql");
/**
* Set default value for num_recs data token
*/
if (!queryConfig.getToken("num_recs").getValue()){
queryConfig.getToken("num_recs").setValue("10");
}
Executing Queries
executeQuery(queryConfig,
mask, callback, callbackArgs,
errorCallback, errorCallbackArgs)
function.The arguments of this function are:
queryConfig - A QueryConfig
object (see the Defining Queries section)mask - Boolean indicating if a
load mask should display until the query
results are received.callback - The callback
function to execute when then query results
are returned (see the Handling Query Results
section).callbackArgs - An array of
additional arguments to pass to the callback
function. Optional.errorCallback - The callback
function to execute if the query returns an
error (see the Error Handling and Messaging
section). Optional if default error
messaging behavior is desired.errorCallbackArgs - An array of
additional arguments to pass to the error
callback function. Optional./**
* Execute the initial query, indicating renderDonut()
* as the callback
*/
this.executeQuery(queryConfig, true, this.renderDonut);Handling Query Results
callbackArgs.renderPieChart
as the callback function. datum
and innerRadius are passed as
callback arguments.var queryConfig = this.getQueryConfig("drilldown"); this.executeQuery(queryConfig, false, this.renderPieChart, [datum, innerRadius]); ... /** * Renders the pie chart*/ renderPieChart: function(queryResults, datum, radius) { // Render pie chart }
QueryResults
QueryResults
object is returned as the first argument to
every query callback function. The object
contains the records returned from the
query, the queryConfig object that defined
the query and other query metadata.queryResults.getRecords()
to return the array of data records returned
from the query. Data records take the form
of simple key/value pairs, as dictated by
the EQL query:RETURN data AS SELECT
%metric_1% AS metric,
%groupby_1% AS groupby
FROM "%dataview%"
GROUP BY groupby;{groupby:
"France", metric: 5.14}, {groupby:
"Minnesota", metric: 7.23}, ...]queryResults.getQueryConfig()
returns the queryConfig
that defined the query.queryResults.getRecordCount()
returns the number of data records
returned to the renderer.queryResults.getTotalRecordCount()
returns the total number of data records
the query produced. Due to paging, etc.
this value may exceed that returned by queryResults.getRecordCount().Rendering the Visualization
1. Configure and acquire the Canvas object
2. Acquire the root element of the Canvas
3. Use DOM manipulation or rendering technology of choice to add elements to the root element
Canvas
getCanvas()
to acquire the singleton instance of the
Canvas object. Through the canvas object,
the root
DOM element is acquired, on which elements
of the visualization may be appended.Acquiring the Canvas Root
<text> element:var newElement = document.createElement("text");
var newText = document.createTextNode("Hello!");
newElement.appendChild(newText);
var canvas = this.getCanvas();
canvas().getRoot().appendChild(newElement);
var canvas = this.getCanvas();
d3.select(canvas().getRoot()).append("text").text("Hello!");canvas().getRoot()
return the root element with any existing
content intact. The clear argument may be
passed to remove all inner content and
return the root as an empty element.Canvas Configuration
canvas().getRoot() return the root
element as a <g> container element
wrapped in an <svg>
element to serve as the canvas's root
element (i.e. <svg><g></g><svg>).
If a different DOM element is desired as the
root element, use the tagName
configuration option.Canvas width and height are determined by the Edit Settings panel and may not be altered through the API. To modify the dimensions of the canvas space, apply margins using the margins configuration option.
In this example, the canvas object is acquired with its root configured to be a
<div>
with its top and bottom margins set to 10:Configure Canvas
var canvas = this.getCanvas({
tagName: 'div',>
margins: {top: 10, bottom: 10}
});Testing for Canvas Content
canvas.isRendered()
on the canvas object to return a boolean
indicating if any
content has been appended to the canvas
root.Clearing Canvas Contents
canvas.clear()
removes the child nodes of the
canvas root element.Canvas Properties
canvas.getMargins()
returns the margins configured for
the canvas. The default margins are { top:
20, bottom: 20, right: 20, left: 20}.canvas.getWidth() and canvas.getHeight()
returns the width and height of the canvas
minus the relevant margins. These are the
dimensions of the actual "drawing space"
available to the renderer to draw the
visualization.Add Visualization Elements
At this point,
the developer is left to their own
creativity. canvas.getRoot() provides
the canvas space's top-level DOM element and
the developer is free to add, remove, modify
child elements using the rendering
technology of their choice.
The following example demonstrate one of a
multitude of ways to render visualization
elements. This example takes the raw data
records and passes them through a D3 pie
layout function to translate data into
"angle" data, representing the start and end
points for each segment of the donut. This
is an intermediary step to leveraging the D3
arc function which translates the angle data
into path data which represents the size and
positioning of the segment.
renderDonut: function(queryResults) {
var self = this;
/**
* Get references to the data records and the queryConfig that
* defined the query.
*/
var records = queryResults.getRecords();
var queryConfig = queryResults.getQueryConfig();
/**
* Get default color manager
*/
var colorMgr = this.getColorManager();
/**
* Ready-made D3 layout function for pie-type charts. The metric
* property if each data record serves as the value used
* to compute each pie segment.
*/
var pieLayout = d3.layout.pie()
.sort(null)
.value(function(d) { return d.metric;});
/**
* Use pieLayout to transform raw data into angle data
* for replacement on donut
*/
var data = pieLayout(records);
/**
* Acquire reference to canvas, setting the top and bottom
* margins to 10px
*/
var canvas = this.getCanvas({
margins: {top: 10, bottom: 10}
});
/**
* Get canvas height and width to calculate donut radii
*
*/
var width = canvas.getWidth();
var height = canvas.getHeight();
var outerRadius = Math.min(width, height) / 2;
var innerRadius = outerRadius - 20;
/**
* D3 Arc function to calculate paths for donut segments
*
* Arcs: https://github.com/mbostock/d3/wiki/SVG-Shapes#arc
*/
var donutArc = d3.svg.arc()
.outerRadius(outerRadius)
.innerRadius(innerRadius);
/**
* Get canvas root selection to begin rendering
*/
var root = d3.select(canvas.getRoot());
/**
* Centers the donut in the root
*/
root.append("g")
.attr("class", "wrapper")
.attr("transform", "translate(" + width / 2 + "," + height / 2 + ")");
/**
* Create D3 data update selections with the transformed data.
* The key function:
*
* function(d) { return d.data.groupby; }
*
* indicates the record's groupby value is to be used
* as a unique identifier.
*
* https://github.com/mbostock/d3/wiki/Selections#data
*/
var segments = root.select(".wrapper").selectAll(".segment")
.data(data, function(d) { return d.data.groupby; });
/**
* Pie segments are added for each data record not already associated with data. These elements
* begin as single-pixel lines at their starting angle and expand to full size. To accomplish this,
* we set the segments endAngle to its starting Angle. We'll store this configuration in _currentPos for
* use later in the transition.
*
* Then add tooltips to segment paths by adding the bdd:tooltip attribute to each segment.
*
* Mouseover/mouseout listeners are configured for each segment using the d3 'on' function. These listener functions
* adjust the segment's fill opacity attribute on mouseover and mouseout. The d3 'on' function is used to configure a
* 'click' listener which draws a pie chart in the center of the donut that visualizes the "drilldown" query
* (see showPieChart())
*/
segments.enter()
.append("g")
.attr("class", "segment")
.append("path")
.attr("d", function(d) {
return donutArc(d)
})
.attr("class", "path")
.style("fill", "#ffffff")
.style("stroke", "#cccccc")
.attr("bdd:tooltip", function(d){
var metricDisplayname = queryConfig.getToken("metric_1").getDisplayName();
return d.data.groupby + ": " + metricDisplayname + " " + d.data.metric;
})
.on('mouseover', function(d,i) {
segments.selectAll(".path").style("opacity",0.5);
d3.select(this).style("opacity",1.0);
})
.on('mouseout', function(d,i) {
segments.selectAll(".path").style("opacity",1.0);
})
.on('click', function(d,i){
segments.selectAll(".path").style("opacity",0.5);
d3.select(this).style("opacity",1.0);
self.showPieChart(this,d,innerRadius);
})
},
Truncate Text
In HTML, the CSS
style text-overflow: ellipsis;
can be used to truncate text that has a
length that exceeds the width of the DOM
element in which it is to display. The style
rule truncates the text at the appropriate
point and appends ellipses. Unfortunately,
this CSS style cannot be applied to SVG
elements. The truncateText(elmt,
width, padding) convenience
function mimics this behavior for text
within SVG elements.
In the example below, all text elements are
iterated over using the d3 each() function
and truncateText() is called
to truncate the text to fit 100 pixels with
a 5px padding.
g.append("text")
.attr("transform", function(d) { return "translate(" + pieArc.centroid(d) + ")"; })
.attr("dy", ".35em")
.attr("class", "pieLabel")
.style("text-anchor", "middle")
.text(function(d) { return d.data.groupby; })
.each(function(d) {self.truncateText(this, 100, 5) });Using Colors
The Color Manager may be used to manage color. The Color Manager the D3 Ordinal Scales, the is standard practice for visualization color management when working with D3. Using an ordinal scale provides consistency of color when it is desired to associate a color with a specific data point. For example, a grouped bar chart that renders multiple bars, with each bar representing a different metric, for each group by value. It is desired that when a bar representing a metric is rendered that it is colored the same as every other bar representing that metric. The Color Manager provides this capability.
getColorManager()
call. Though separate instances of the Color
Manager may be instantiated directly ({{
var colorMgr = new
Oracle.BDD.Portlets.Visualization.Util.ColorManager();
}}, this is rarely necessary as the
Color Manager's purpose is to provide
consistency of color and use of the
BaseRenderer's singleton instance is preferred. The following
example represents the most basic use of the
Color Manager. When getColor("border")
is first called on the Color Manager, the next
unassigned color in the Color Manager's color
library is returned. Subsequent calls to getColor("border")
return the same color value.
var colorMgr = this.getColorManager();
var borderColor = colorMgr.getColor("border");
...
// Use the same color for the divider as was used for the border
var dividerColor = colorMgr.getColor("border");Setting the Color Library
A default
library (the same used in the D3 Charting
portlet) has been provided. However, an
array of any length of colors may be
provided to serve as the color library.
Alternatively, a string values of '10', '20'
or '20b' may be passed to set the color
library to those of the D3 category10,
category20 or category20b libraries,
respectively. See D3 Categorical Colors.
The color library may be set in one of three
ways:
As a
configuration option of
this.getColorManager():
var colorMgr = this.getColorManager({
library: ["#cccccc", "#999999", "#666666"]
});
var colorMgr = new Oracle.BDD.Portlets.Visualization.Util.ColorManager({
library: ["#cccccc", "#999999", "#666666"]
});Using the
setLibrary()
function:var colorMgr = this.getColorManager();
colorMgr.setLibrary(["#cccccc", "#999999", "#666666"]);
Setting the Scale Domain
getScaleDomain()
sets the array of values to use as the color
scales domain. This can be thought of as
establishing lookup keys which can be used
with the getColor() function
to acquire the same color value for each
'key'. This is the means to ensure that any
instance of the ColorManager configured with
the same library will return the same color
for the given key value (getColor(domainKey)).
Setting a scale domain is optional; one
instance of the ColorManager will always
return the same value for the same input
key. Setting a scale domain ensures
consistency across multiple instances of the
ColorManager (i.e. from page request to page
request).
If a scale domain is not configured, then
the Color Manager behaves as so:
1. The first call to getColor(domainKey)
returns the first color in the
color library array.
2. If domainKey argument
is the same as the above, then getColor(domainKey)
returns that same color
3. If domainKey is
the different than the above, then getColor(domainKey)
returns the next color in the color library
array
4. When an unassigned
domain key is provided and the end of the
color library has been reached, getColor(domainKey)
returns the first color.
As a
configuration option of this.getColorManager():
var colorMgr = this.getColorManager({
scaleDomain: ["High", "Mid", "Low"]
});var colorMgr = new Oracle.BDD.Portlets.Visualization.Util.ColorManager({
scaleDomain: ["High", "Mid", "Low"]
});setScaleDomain()function:var colorMgr = this.getColorManager();
colorMgr.setScaleDomain(["High", "Mid", "Low"]);Tooltips
Any element on the
canvas may be equipped with a mouseover tooltip
by adding the bdd:tooltip
attribute to the element's tag.
labels.attr("bdd:tooltip", "Click to refine")
.text(function(d) { return d.data.groupby; })
Refinement
The JavaScript API allows for simple refinement of the navigation state. When refinements are added to the QueryConfig object and the query is executed, all portlets on the page that respond to data change events will be effected.
addRefinement(tokenName,
value) adds a refinement of the given
token's attributeKey and the value(s) provided.
value may be a single value, or an
array of values. In this example,
labels are given an onclick event listener which
responds by adding a refinement to the groupby_1
token's attribute, setting the groupby
property value as its refinement value. The
query is then executed, designating self.renderPieChart
as the callback function.
Add Refinement
labels.on('click', function(d,i) {
queryConfig.addRefinement('groupby_1', d.groupby);
self.executeQuery(queryConfig, true, self.renderPieChart);
});Note that the above can also be accomplished with the
refine() convenience
function of the BaseRenderer:Add Refinement (Alternate)
labels.on('click', function(d,i) {
self.refine(queryConfig, 'groupby_1', d.groupby, self.renderPieChart);
});Error Handling and Messaging
When an error is received from portlet is response to a query, the default behavior is to clear the canvas of any content and display the error in the portlet (not in the visualization or in the canvas space).
errorCallback function as argument to
the executeQuery(). The error
callback function is passed the error message as
its first argument. Additional arguments to pass
to the callback function may be provided in the
errorCallbackArgs argument of the executeQuery()
call.In this example, the "drilldown" query is executed and
renderPieChart is
designated as the query callback function. It is
desired that should this query return an error,
the existing visualization (the donut) remains
intact, but the returned error is displayed in
place of the pie chart. Therefore, handleQueryError
is designated as the error callback function to
provide this behavior.Error Handling
showPieChart: function(segment, d, innerRadius) {
this.clearPieChart();
var queryConfig = this.getQueryConfig("drilldown");
queryConfig.getToken("filter").setValue(d.data.groupby);
this.executeQuery(queryConfig, false, this.renderPieChart, [d, innerRadius], this.handleQueryError);
},
handleQueryError: function(err) {
d3.select(this.getCanvas().getRoot())
.select(".wrapper")
.append("text")
.attr("width", 200)
.attr("text-anchor", "middle")
.attr("text-align", "center")
.attr("fill", "red")
.attr("class", "error")
.text(err);
}Portlet Messaging
displayError(err,
clear) displays the provided error
message in the portlet error messaging space. displayMessage(msg,
clear) displays the provided message in
the portlet "info" messaging space.
Clearing Canvas Content When Displaying Messaging
In both displayError(err,
clear) and displayMessage(msg,
clear), the clear parameter may be
passed to indicate if the canvas should be
cleared of content when the message displays.
/**
* Contents of the canvas root are cleared and an error message is displayed in the portlet space.
*/
this.displayError("Visualization could not be rendered", true);
/**
* Error message is displayed in the portlet space while keeping canvas content intact.
*/
this.displayError("Refresh page.", false);Zero Results
Valid queries that
return 0 records do not invoke error callback
functions. The renderer class is expected to
implement handling for 0 results conditions in
the query callback function according to the
needs of the visualization.
Zero Results
if (queryResults.getRecordCount() == 0) {
this.displayMessage("Query returned no results", true);
}Number of Results > Number of Returned Records
Certain
visualizations require that all records from a
query are returned for the visualization to
render accurately. Call queryResults.getRecordCount()
and queryResults.getTotalRecordCount()
to evaluate for this condition.
Results Exceed Returned
if (queryResults.getRecordCount() != queryResults.getTotalRecordCount()) {
this.displayError("This visualization requires more records than can be returned in one query.", true);
}Example Configuration
In the examples above, the Visualization Configuration is:
Visualization
name = Donut_Pie (CVC can be user
defined during configuration in Studio)
JavaScript
file = donut_pie_renderer.js
This file is available in the
CVC_sample_code.zip file. It can be found and
downloaded from the Before You Begin -> What
Do You Need? section of this tutorial.
Renderer class =
Oracle.BDD.Portlets.Visualization.Renderers.DonutPieChart
Sort type =
Defined
Advanced Options
CSS
.label, .path {
cursor: pointer;
}
EQL Queries
eql =
RETURN data AS SELECT

                                        %metric_1% AS metric,

                                        %groupby_1% AS groupby

                                        FROM "%dataview%"

                                        GROUP BY groupby

                                        ORDER BY metric %sort%

                                        PAGE(0,%num_recs%);
drilldown =
RETURN data AS SELECT
%metric_1% AS metric,
%groupby_2% AS groupby
FROM "%dataview%"
WHERE %groupby_1% = '%filter%'
GROUP BY groupby
ORDER BY metric %sort%
PAGE(0,%num_recs%);
Tokens
| Token | Type | Subtype | Data Types | Aggregations |
|---|---|---|---|---|
| %metric_1% | attribute | metric | double, long | sum |
| %groupby_1%, %groupby_2% | attribute | dimension | string | |
| %dataview% | view | |||
| %num_recs%, %filter% | data | |||
| %sort% | sort |
Want to Learn More?
-
Oracle Big Data Discovery Cloud Service page on the Oracle Help Center.
-
Oracle Big Data Discovery page on the Oracle Learning Library
- Oracle Big Data Discovery page on the Oracle Technical Network
- Oracle Big Data Discovery page on YouTube